World population density
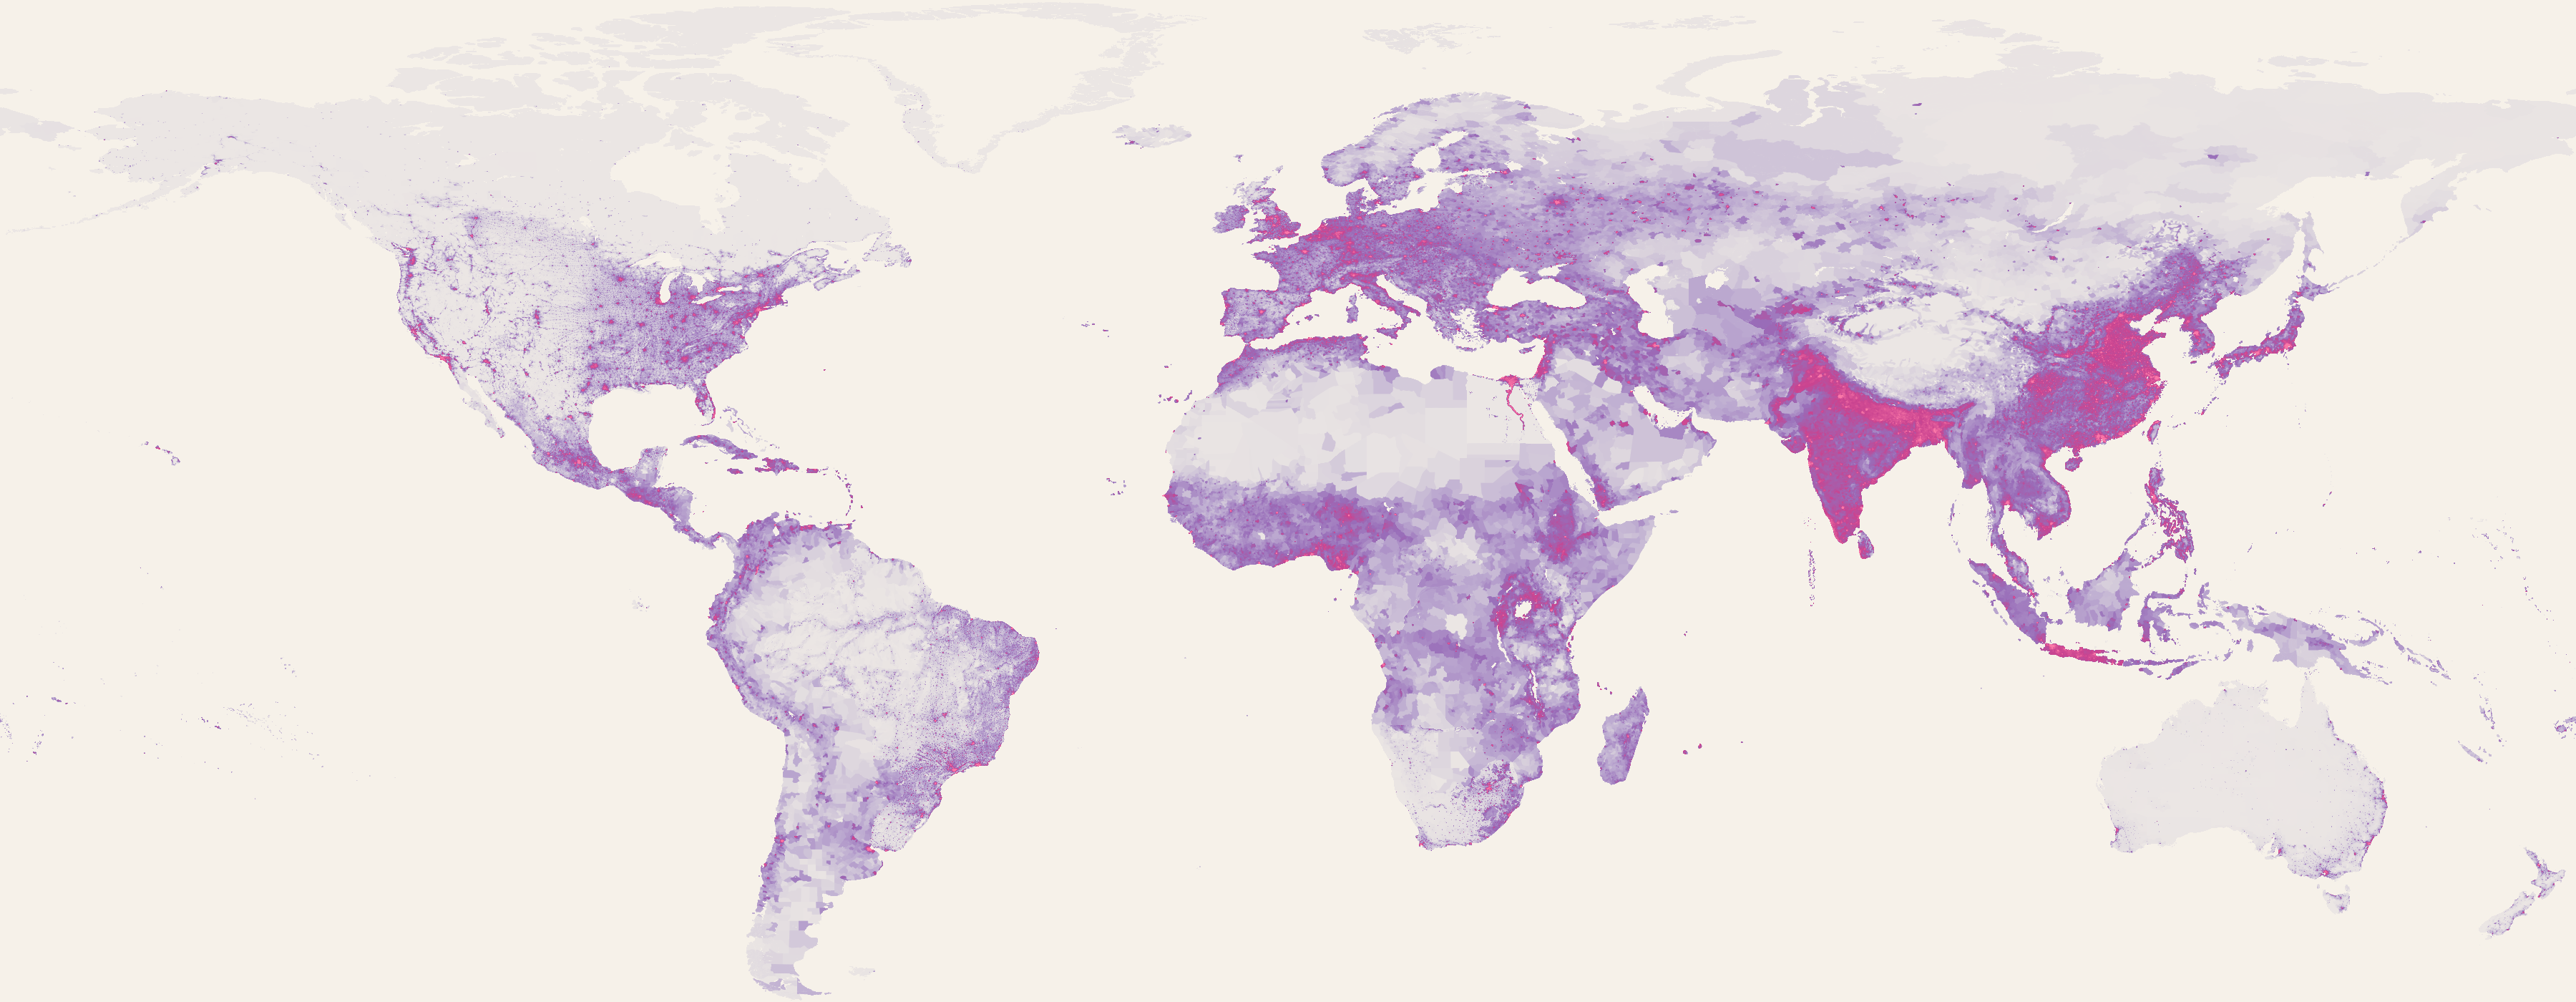
A flat map of where humanity actually lives. Every inhabited cell of a 0.1° grid — roughly 11 km on a side at the equator — is tinted by its density in people per square kilometre, on a logarithmic scale. Built from NASA SEDAC's Gridded Population of the World, adjusted to 2015 UN totals.
What the map shows
Asia holds the mass
The single brightest structure on Earth is the arc from the Ganges plain through Bangladesh, southern China and Java. More than half of humanity lives inside it.
The sharpest line on Earth
Egypt's Nile valley and delta glow as a thin magenta ribbon in an otherwise empty Sahara — almost the entire population pressed onto ~4% of the land.
The empty quarters
The Sahara, the Arabian interior, the Australian outback, Amazonia, Siberia and the high Arctic stay near-blank: vast area, almost no one.
Density ≠ development
Bright does not mean rich. Rural Bengal and Java reach city-like densities on farmland, while wealthy North America and Australia are mostly pale.
How it was made
- The world is divided into a grid of 0.1° × 0.1° cells (~11 km at the equator). Each of the 1,538,045 inhabited land cells carries a population count and its true area in km².
- Density = people ÷ area. Values span from a fraction of a person per km² up to ~41,800 in the densest urban cores, so colour is mapped on a logarithmic scale.
- Every inhabited cell keeps a faint silhouette so the continents stay legible; opacity and hue then climb with density.
- Fully reproducible: a single build script rebuilds the image directly from the source grid.
Sources
- Population grid. CIESIN, Columbia University. Gridded Population of the World, Version 4 (GPWv4): Population Count, Adjusted to Match 2015 UN WPP Country Totals, Revision 11. NASA SEDAC, 2018. sedac.ciesin.columbia.edu
- Tidy grid extract. Michal Migurski, openaddresses/population — a CSV derived directly from the SEDAC GPWv4 raster. github.com/openaddresses/population
- Population totals. United Nations DESA, World Population Prospects. population.un.org/wpp